

It is easy to imagine the case for connecting sensors to the Raspberry Pi for industrial applications. In particular, they are widely used for temperature and humidity control.
When “visualizing” the acquired data, graphs and numerical tables are effective, but displaying the data overlaid on a drawing is more intuitive.
This time, we realized it with Grafana.
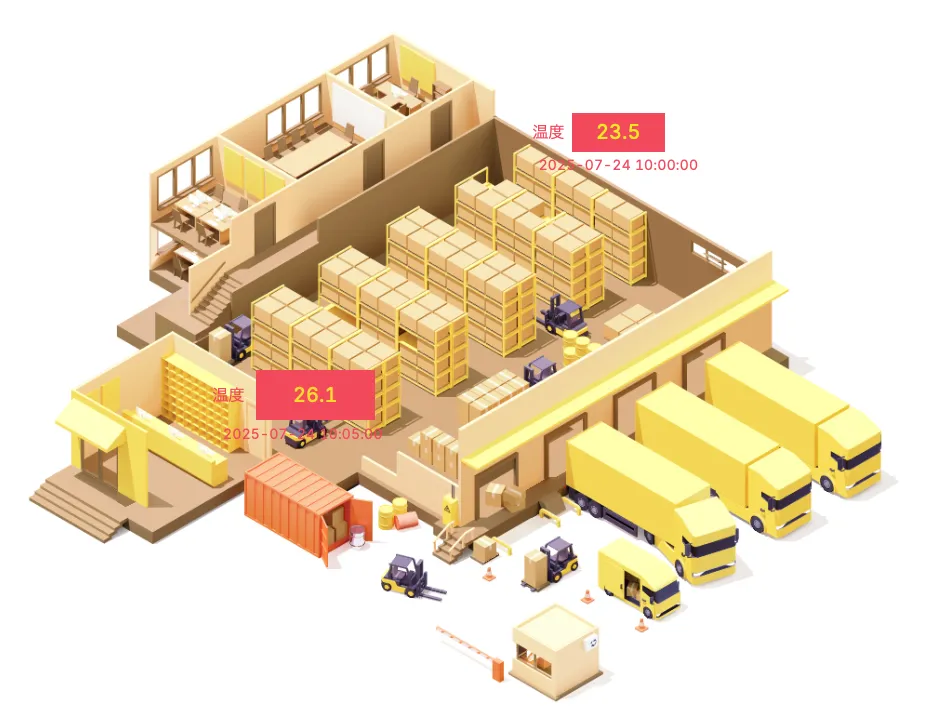
The following image is an example using test data in the database, but in reality data from sensors can be updated and displayed in real time.
With the increase in extreme weather in recent years, many industries are facing challenges in dealing with heat.
In the logistics industry, such as warehouses and distribution centers, as well as in production plants and retail stores that handle food products, it is expected that temperature and humidity control of products will become more difficult than in the past.
At such sites, sensors connected to industrial Raspberry Pi can be used as a system to measure each area and efficiently control air conditioning.
This not only controls the quality of the products, but also improves the environment for the employees who work there.
The article will show you how to install and use Grafana on the industrial Raspberry Pi PL-R5M.
Note that Grafana Cloud is not used and is intended for installation in a local environment.
What is Grafana?
Grafana is an open source platform.
It is mainly used to “visualize” data in real time.
It features the ability to connect to a variety of data sources, including time-series databases, sensor data, monitoring servers and IoT devices, and various cloud service uses.
In addition to graphs and numerical tables, as in this test, it can be displayed in a variety of formats, including map images.
The alert function is also practical, with the ability to set threshold values for notifications.
It can be used for small personal use to full-scale industrial applications.
- Multi-data source support
- Dashboard Customization
- alert function
- Extensible with plug-ins
With Grafana Cloud, it is also possible to collect data with Prometheus, which is also open source, and centrally manage it using a database created in Grafana Cloud.
Because it is open source, it is free for local environments, and Grafana Cloud is also available from a free plan, making it easy to implement.
Installing Grafana
For Ubuntu and Debian systems, it can be installed with the apt package management system.
After adding the GPG key and repository, install with the apt command.
Install what you need first (if you don’t use SQLite for DB, you don’t need the second line)
sudo apt install software-properties-common
sudo apt install sqlite3
Download and move GPG keys
wget -q -O - https://apt.grafana.com/gpg.key | gpg --dearmor | sudo tee /etc/apt/keyrings/grafana.gpg > /dev/nullRegister as a repository
echo "deb [signed-by=/etc/apt/keyrings/grafana.gpg] https://apt.grafana.com stable main" | sudo tee /etc/apt/sources.list.d/grafana.listInstall with apt command
sudo apt update
sudo apt install grafana
Service initiated and always valid
sudo /bin/systemctl start grafana-server
sudo /bin/systemctl enable grafana-server
After this, you can work with a Web browser.
If you are in the same network, you can connect to your web browser at http://<ip address>:3000.
Log in to Grafana
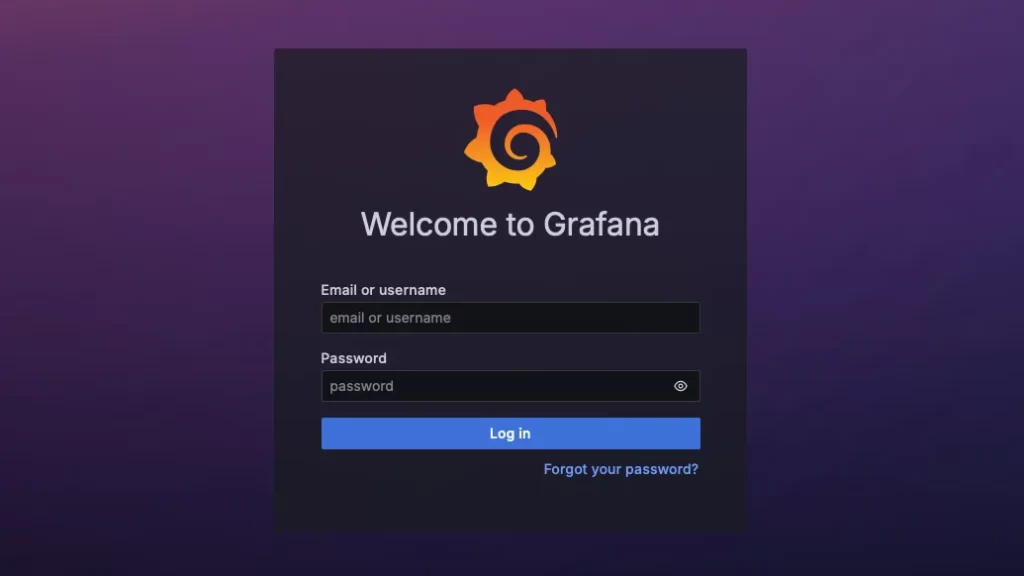
When you connect from a web browser, you will be taken to the login screen.
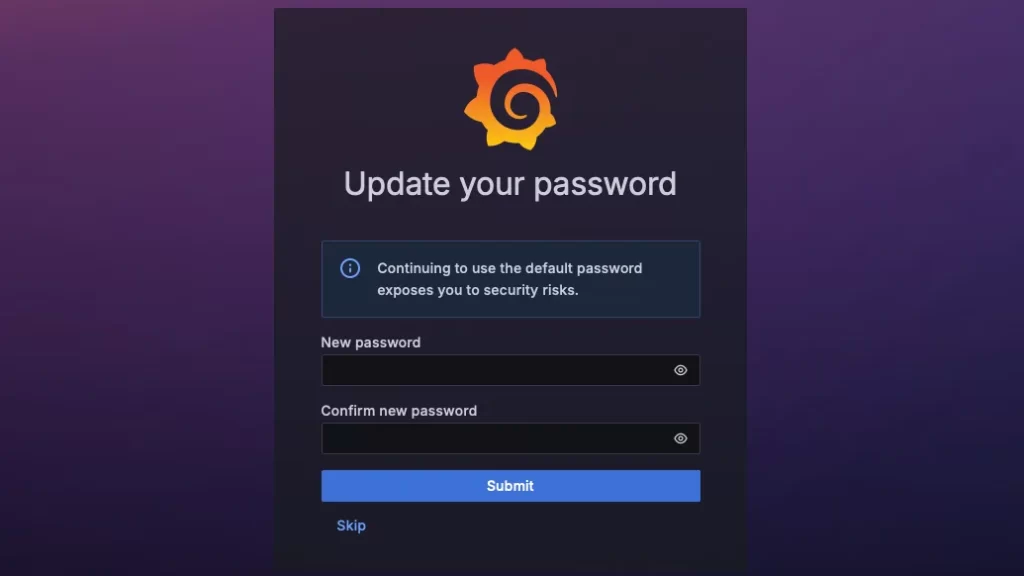
Log in to Grafana with the default user name adminand default password admin. You will then be asked to change the administrator user password for the first time only.
Test Data Preparation and Setup
First, as test data, we have prepared a shell script for creating the database and a json file for the dashboard.
I will make them available for download at the end of the article, in case some of you would like to try the same. We hope you will make use of them.
Transfer (copy) the three files used for test data to the Raspberry Pi in advance.
💡 If you want to copy from another machine to the Raspberry Pi, SCP command
scp (オプション)転送するファイルへのパス 転送先の場所のパス
scp [[user@]ホスト 1:]ファイル 1[...] [[user@]ホスト 2:]ファイル 2
scp ./create_db.sh pi@192.168.0.51:/home/pi
The database is prepared in a sh file with the following contents and run to create the sensor_data.dbfile.
This is done on the Raspberry Pi side.
#!/bin/bash

DB_FILE="sensor_data.db"

sqlite3 "$DB_FILE" <<EOF
CREATE TABLE IF NOT EXISTS sensor (
    address INTEGER,
    temp REAL,
    humidity REAL,
    "update" TEXT
);

INSERT INTO sensor (address, temp, humidity, "update") VALUES
(1, 23.5, 45.2, '2025-07-24 10:00:00'),
(2, 26.1, 50.8, '2025-07-24 10:05:00'),
(3, 22.9, 42.0, '2025-07-24 10:10:00');
EOF
.db file is saved to /var/work/grafana_test. create_db.shCopy and execute the file with execute rights granted.
sudo mkdir -p /var/work/grafana_test
cd /var/work/grafana_test
sudo hmod +x create_db.sh
./create_db.sh
Likewise, the image file (sample.png) was copied to /usr/share/grafana/public/img/bg.
This is the default (standard) loading destination in Grafana.
sample.jsoncan be dragged and dropped from other machines, so there is no need to copy it to the Raspberry Pi.
Configure with Grafana
Once you have made these preparations, it is time to set up on the Grafana side.
To use SQLite for the database, install the SQLite plugin first.
Installing Plug-ins
Follow the left menu as follows and select SQLite:
Administration – > Plugins and data – > Plugins – > SQLite
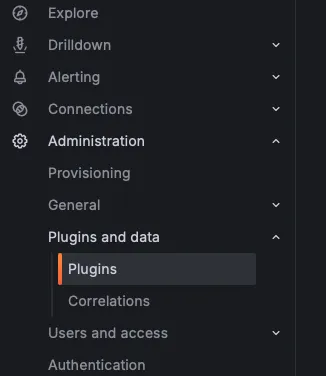
You can use the search window to narrow down your search.
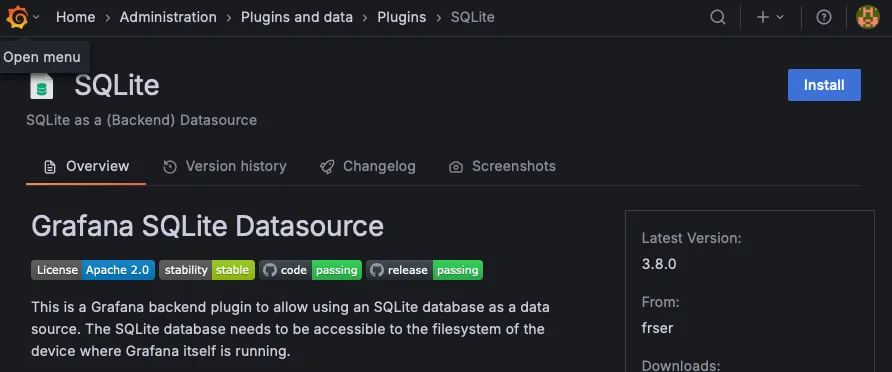
The screen you click on has an Install button, so just press the button.
Canvas is also required to handle images, but in the current version, it is installed from the beginning and no work is required.
Specify Data Sources
Specify the *.db file you just created on the Raspberry Pi as the data source.
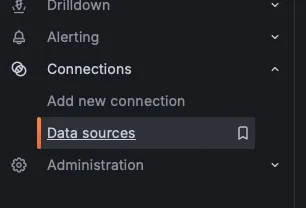
Select and specify SQLite as the data source from the left menu.
Connections — > Data Sources – > sqlite
Here we have entered only the Path.
This is the full path to the *.db file you just entered.

Name: frser-sqlite-datasource
Path:/var/work/grafana_test/sensor_data.db
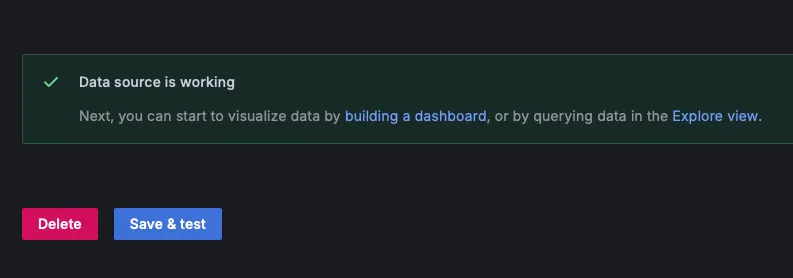
Finally, by pressing the Save & Test button, it is OK if Data source is workingis displayed.
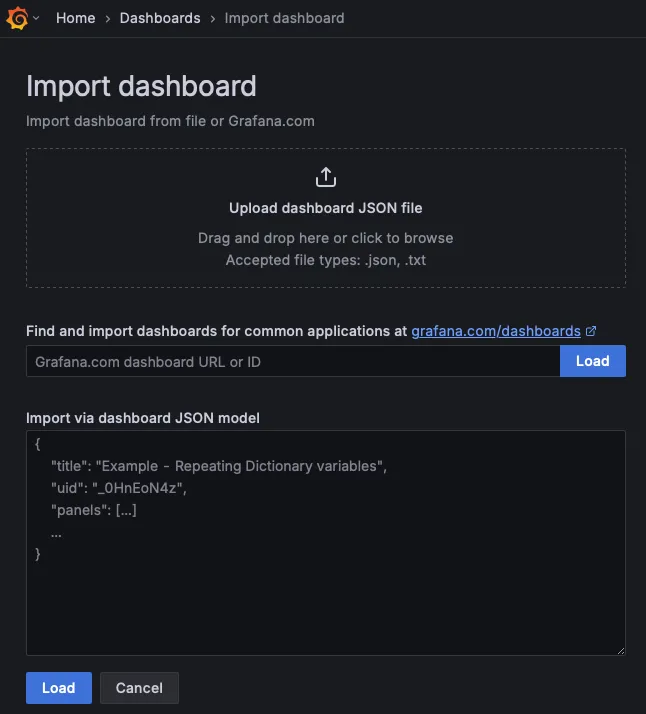
Import json files in the dashboard
In this case, we have prepared a sample.json of the dashboard created in advance, which we will import.
The following JSON model is a data structure that defines a dashboard. This includes dashboard settings, panel settings, layouts, queries, etc. When you click on Dashboards in the menu, you can choose Import from the New button in the upper right corner.

The json file was uploaded by drag and drop.
⚠︎ Notes UID
The UID is assigned when the database is created. This is assigned at the time of creation. It was also included in the json file we prepared this time. Since the json file was exported from the dashboard beforehand, the uid was left in the JSON model.
After importing the data, I found that the data was not displayed, so I went back and read it again, and it seems that the UID was specified incorrectly. The reason is that the UID is different from the UID of the current database.
The json files can be edited after import.
The part that specified the UID is formatted as follows.
      "datasource": {
        "type": "frser-sqlite-datasource",
        "uid": "devqnl8xvnrwgf"
In the prepared sample.json, these are lines 27, 340, and 351.
You can either set the value to nullor delete the uid key in the first place.
Alternatively, I could specify the uid in the database I created afterwards and it would still work.
Only the uid of the first existing annotations list and the uid of the dashboard itself should be retained.
{
  "annotations": {
    "list": [
      {
        "builtIn": 1,
        "datasource": {
          "type": "grafana",
          "uid": "-- Grafana --"
The dashboard uid at the bottom of the json file remains the same.
Since the title and UID must be unique, it seemed like a good move to change both if they were to be changed.
  "timezone": "browser",
  "title": "Sample",
  "uid": "46ada52f-f62f-41a5-927f-1a597dc35f59",
  "version": 4
}
If you want to manually create a dashboard from scratch, these tasks are not necessary.
Please note that this is only for importing pre-created dashboard json files.
This is also likely to change with the upgrade.
If you import a json file later, review it if you get into a situation where the data does not show up on the dashboard.
This was the way it was handled at the time of writing the article.
Confirmation of Execution
Once you have made these settings, your dashboard will look the same as the image shown at the beginning of this section. Here is an image of a warehouse.
The temperature and acquisition date/time are read from the database.
In actual operation, it can be updated in a certain number of seconds, which is easier to visualize and understand for each area than a numerical table.
The image selected as the background can be changed later./usr/share/grafana/public/img/bgIf you place the image on the “set backgroud”, it will appear on the Canvas on the dashboard with the right-click submenu “set backgroud”.

Setup with test data is now complete.
Then you can add another data source, customize the way the dashboard is presented, and experiment with any other display you wish to achieve.
Using Grafana with Raspberry Pi
Grafana is characterized by its wide range of data import support.
There are also quite a few plug-ins, so you don’t have to worry about interfacing with the cloud services and various data you are using.
Grafana is already widely used and well-known in many companies and sites for system monitoring and industrial applications. It is also a safe bet that there is a lot of information available comparatively.
With Raspberry Pi, sensors can be connected to the GPIO terminals, and an environment in which Python programs can be immediately executed and databases can be handled.
If you install Grafana on the Raspberry Pi, you can easily visualize the data on a dashboard.
Furthermore, the Raspberry Pi can be connected to a monitor via HDMI for full screen display. It is also effective as a permanent monitor for the local environment.
Assuming Grafana is used for industrial applications, it is practical for a wide range of combinations, such as real-time visualization of sensor data, monitoring server status, and its own alerting function.
Collecting multiple data from multiple devices will further expand the scale of use and usage scenarios.
test data
We will keep the three files we used as test data.
Follow the steps in the article to see how Grafana works with your PL-R5M or Pi 5, etc.
Reference: https://grafana.com/tutorials/install-grafana-on-raspberry-pi/

記事寄稿:ラズパイダ
非エンジニアでも楽しく扱えるRaspberry Pi 情報サイト raspida.com を運営。ラズベリーパイに長年触れた経験をもとに、ラズベリーパイを知る人にも、これから始めたいと興味を持つ人にも参考になる情報・トピックを数多く発信。PiLinkのサイトへは産業用ラズベリーパイについて技術ブログ記事を寄稿。